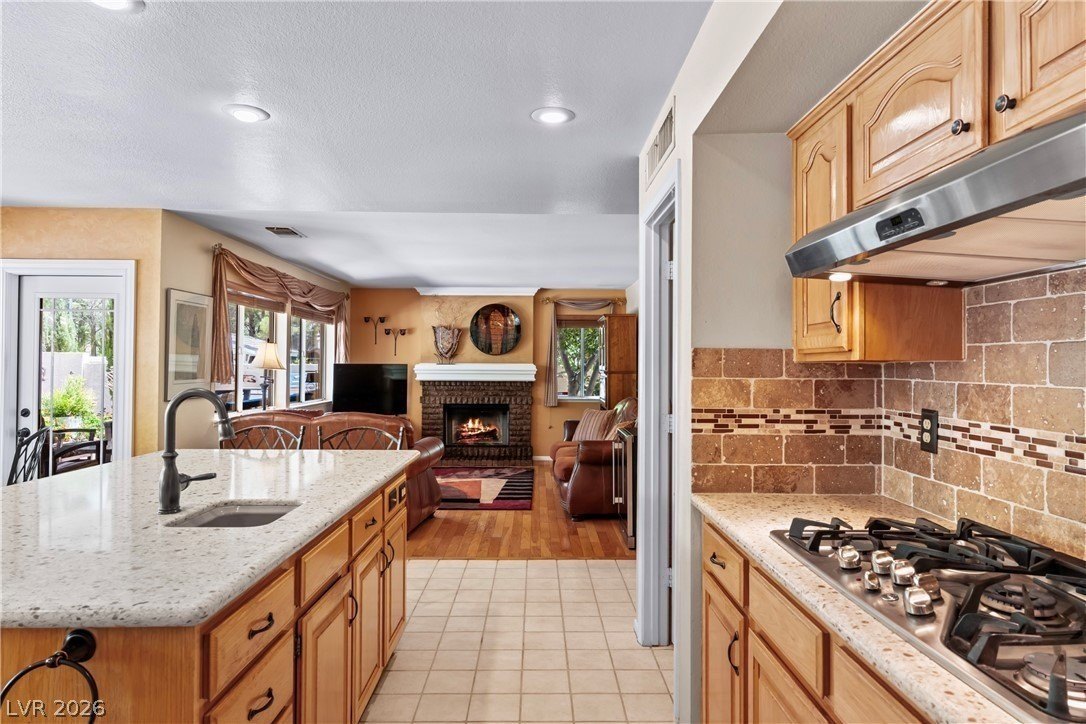
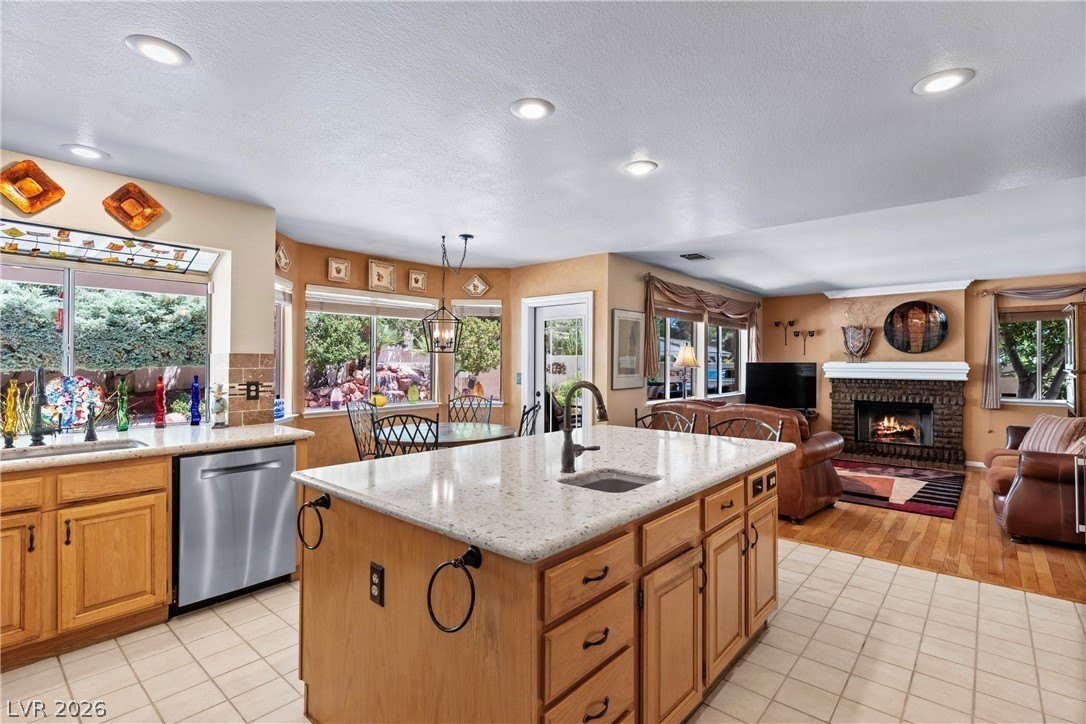
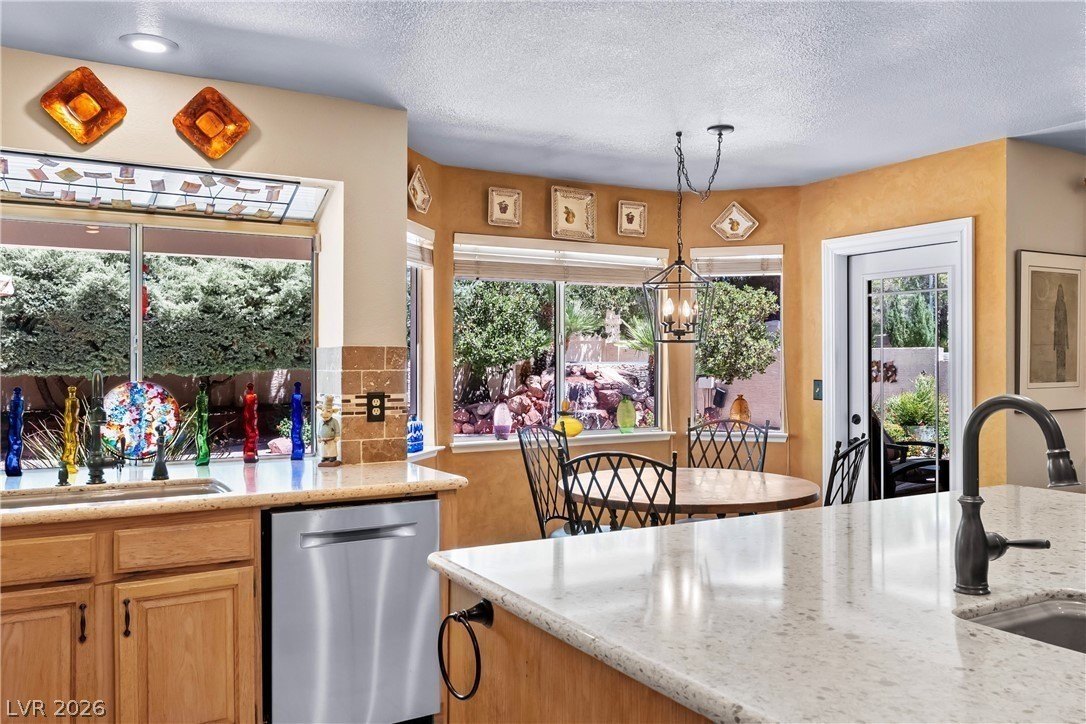
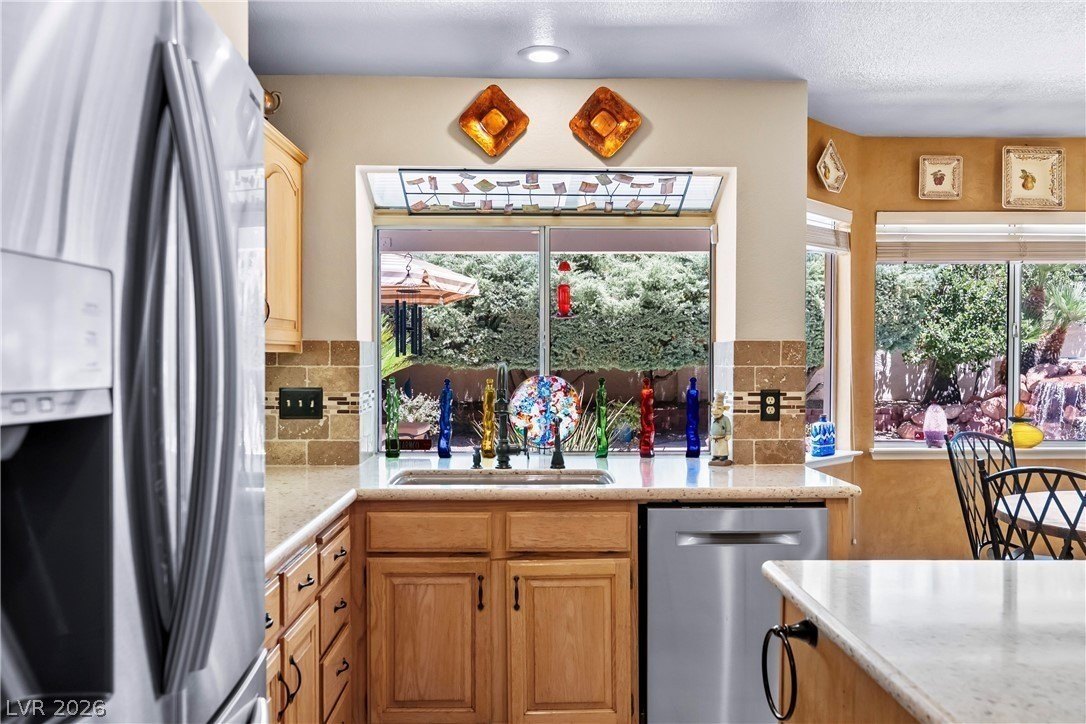
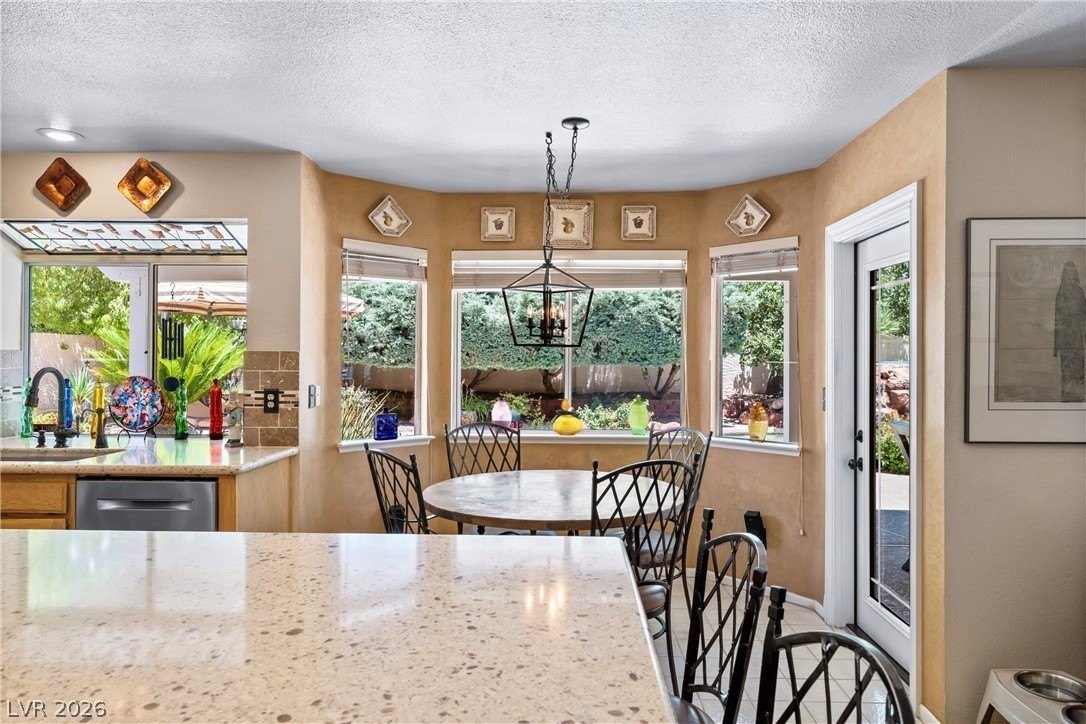
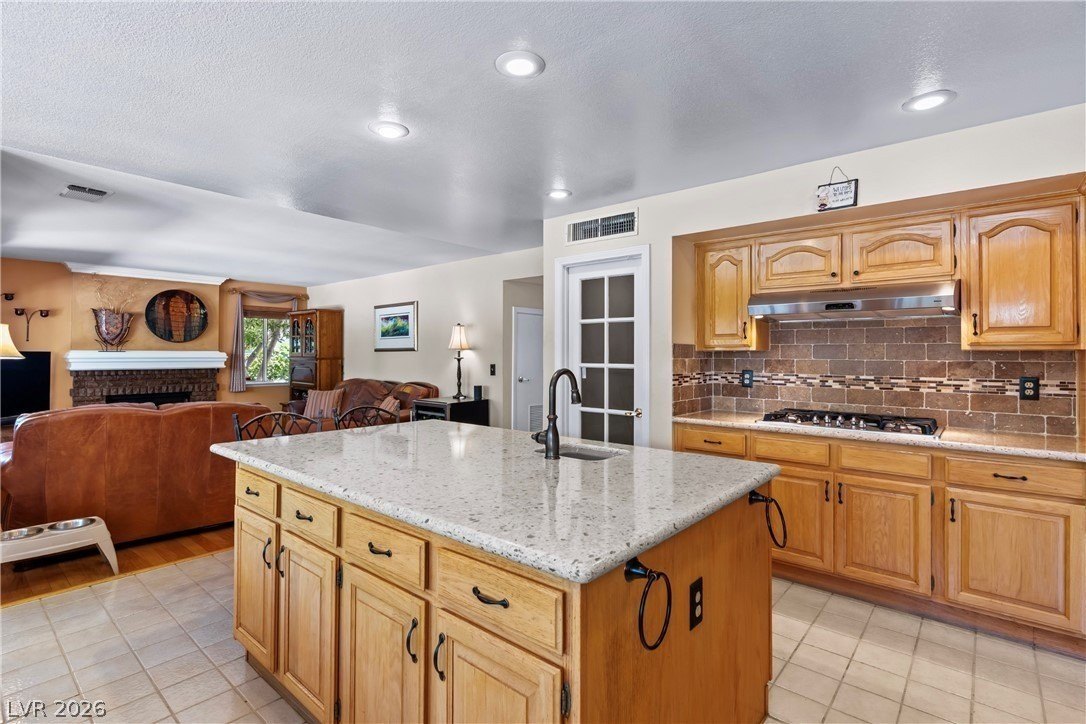
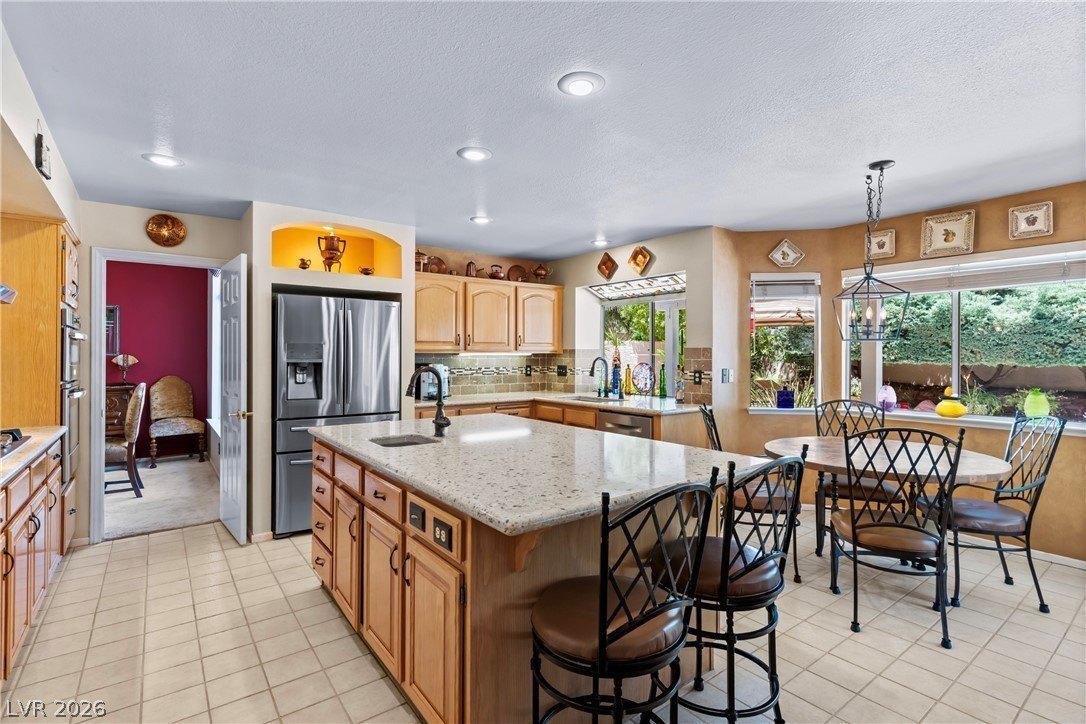
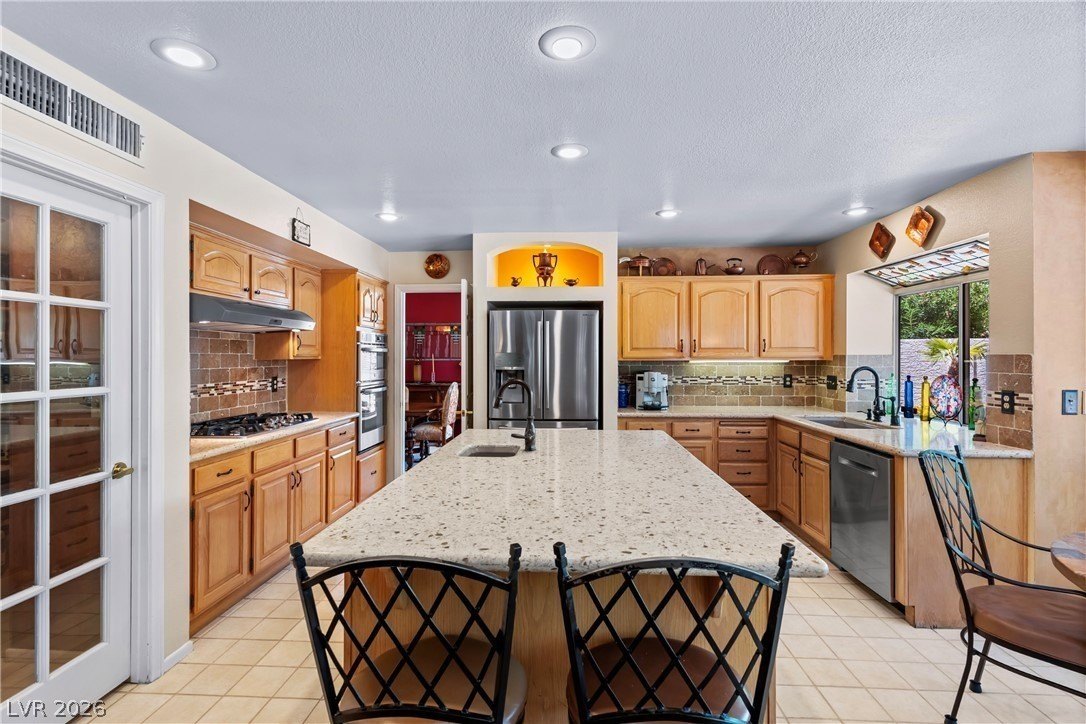
Las Vegas stretches across nearly 11,900 named streets linked by over 17,000 intersections and 4,000 miles of roadway. Five transit options serve the entire city, making personal vehicles the practical choice for covering distances to work, school, and daily needs. The extensive street network connects these destinations efficiently, but this efficiency comes at the cost of scale: most days require driving rather than walking. Walkability concentrates in a few areas, Marion Drive, the East Saint Louis corridor, and parts of Rancho Drive, but these remain exceptions to the car-dependent pattern.
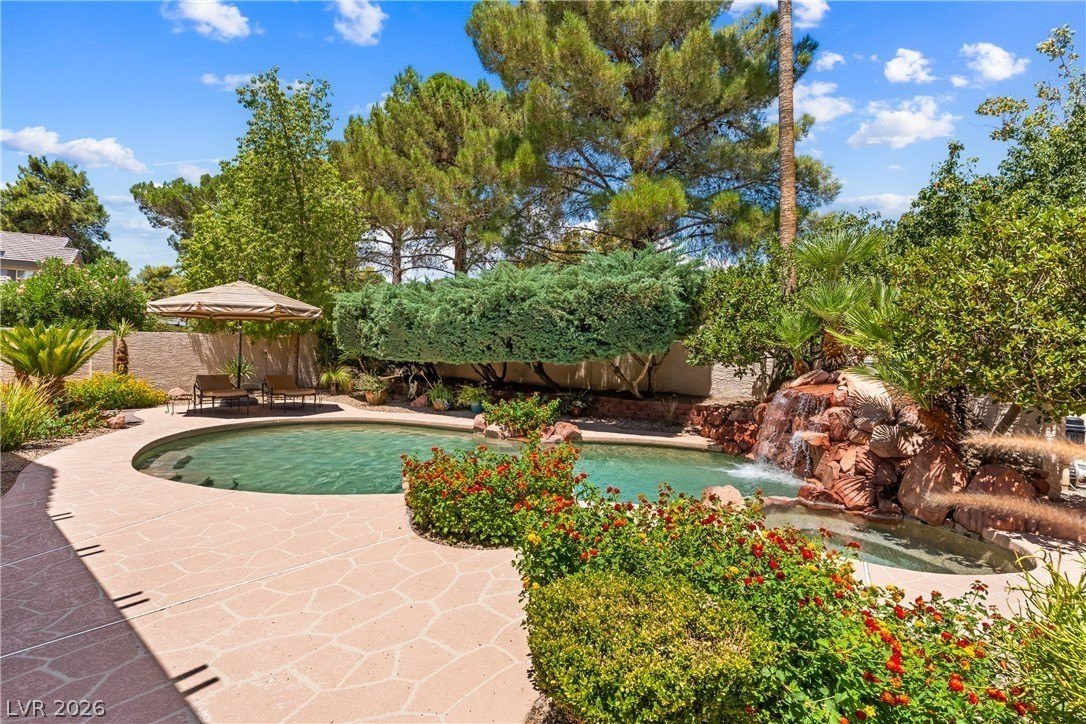
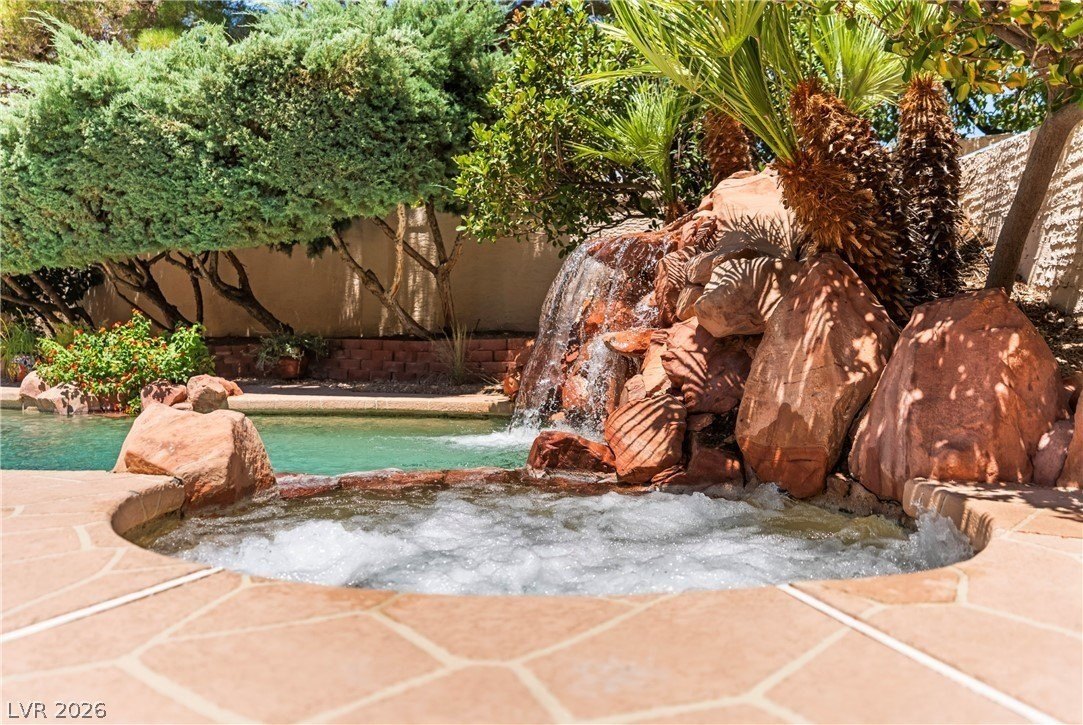
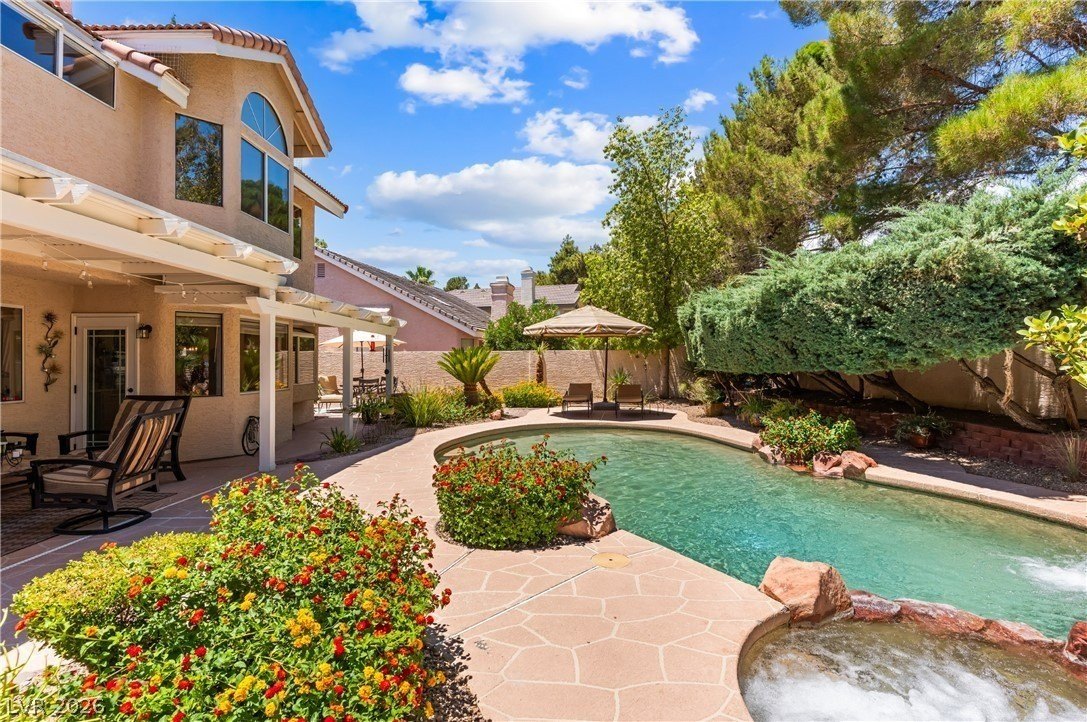
Across the city, 657 restaurants, 1,191 retail shops, and 755 recreational areas shape the commercial and leisure landscape. Schools are spread throughout: 66 elementary, 17 middle, and 12 high schools, plus 104 other education-linked establishments. Recreation includes 476 swimming pools and 804 sports fields, with clusters along Tapestry Park Street and the Marion Drive corridor. Emergency response is quick everywhere: fire crews arrive within half a minute, and medical units are faster still.
Written from the measured record. Where a figure in prose differs from the measured tables on this page, the tables govern - they carry the latest observations.
12 of them are also reachable on foot inside fifteen minutes.
Census Tract 58.06, Clark County · American Community Survey five-year estimates, 2019-2023. Each line reads the immediate census area around this address against the county that holds it.
| Measure | This tract | Across the county |
|---|---|---|
| Residents in this area resident population of the immediate census area around this address | 4,320 people | a county of 2,293,764 |
| Median age median age of all residents | 44.9 years | 38.3 years across Clark County |
| Bachelor's degree or higher share of residents 25 and over holding at least a bachelor's degree | 42.6% | 27.3% across Clark County |
| Graduate or professional degree share of residents 25 and over holding a master's, professional or doctoral degree | 16.6% | 9.3% across Clark County |
| Median household income median annual income across all households, owners and renters together | $81,927 | $73,845 across Clark County |
| Households earning $100,000 or more share of all households with annual income at or above $100,000 | 45.1% | 35.6% across Clark County |
| Households earning under $35,000 share of all households with annual income below $35,000 | 20.5% | 22.3% across Clark County |
| Family households share of households where two or more members are related | 57.8% | 64.2% across Clark County |
| Average household size average number of people per occupied home | 2.47 people | 2.68 people across Clark County |
How the homes standing around this one were built and are held, measured across the same census area.
| Measure | This tract | Across the county |
|---|---|---|
| Owner-occupied homes share of occupied homes lived in by their owners | 57.3% | 57.0% across Clark County |
| Median year built median construction year across all housing here | 1988 | 1997 across Clark County |
| Homes built since 2010 share of all housing units completed in 2010 or later | 1.3% | 14.2% across Clark County |
| Homes built before 1980 share of all housing units completed before 1980 | 10.9% | 17.8% across Clark County |
The parcel as the county itself carries it: identity, the assessment roll, and every recorded change of hands.
This is the parcel's public record as read from the Clark County assessment roll: who has held it, what was recorded at each change of hands, and the values the county carries. Where the listing and the county card agree, that is shown; where they differ, the difference is stated as found.
The county records $260,000 paid on Jun 15, 1999; the published asking price is $799,000.
Every line reads straight off the Clark County assessment roll.
| Roll year | Assessed | Taxable | Change |
|---|---|---|---|
| 2025-26 | $136,017 | $388,620 | |
| 2026-27 | $138,282 | $395,091 | +1.7% |
The change column tracks the taxable figure year over year, exactly as the roll carries it. Source: the Clark County assessment roll.
| Recorded | Event | Price on the document | Holder entering the roll |
|---|---|---|---|
| Jun 26, 2013 | Recorded transfer | R. M- and B. B- | |
| Jun 15, 1999 | Recorded sale | $260,000 | R. M- |
| Apr 3, 1990 | Recorded transfer | A. and S. J- | |
| Jun 30, 1987 | Recorded transfer | Lewis Homes Nevada |
Names are shortened to initials out of respect for the people behind them; the county publishes the full record. A price appears where the recorded document carries one.
| Date | Permit | Detail | Status |
|---|---|---|---|
| June 5, 2025 | Res OTC | permit R25-07575, applicant LEE'S AIR PLUMBING & HEATING, declared value $500 | Closed |
| April 15, 2025 | Res OTC | permit R25-04858, applicant NOTHING BUT WATER HEATERS, declared value $500 | Closed |
| August 31, 2021 | Res OTC | permit R21-14213, applicant DELTA MECHANICAL INC, declared value $500 | Closed |
| December 16, 2018 | Res OTC | permit R18-16643, applicant Water Heater Pros, declared value $500 | Issued |
This is a reading of measured conditions and of what it costs to step in. Today's combination of readings appears in 1 of the 439 months on record.
Conditions as measured, each from an official published series with its own reading date. 30-year mortgage rate (US average) stands at 6.71% as of September 3, 2026 (+0.41 over twelve months and +0.33 over six). Inflation, CPI year-over-year (US) stands at 3.3% as of July 1, 2026 (+0.56 over twelve months and +0.91 over six). Unemployment rate (US) stands at 4.1% as of August 1, 2026 (-0.2 over twelve months and -0.3 over six).
Mortgage rates holding at a high level, employment steady, listed supply elevated oversupply risk and new-home permits running low.
Move the three numbers and watch the monthly cost move with them.
Not an appraisal, not legal or investment advice. Every line marked assumed is an assumption, stated so you can replace it with your own figure.
Every line beside this one is arithmetic. The lines marked assumed carry an assumption, named in the line itself so you can put your own figure in its place.
| Recorded sale | Sold | Price | Interior | $ / sq ft | Built |
|---|---|---|---|---|---|
| 9728 Cascade Falls Ave | July 2026 | $200,000 | 2,466 sq ft | $81 | 1989 |
| 2924 Bridge Creek St | June 2026 | $690,000 | 2,466 sq ft | $280 | 1989 |
| 2808 Cotton Cloud Rd | June 2026 | $610,000 | 2,020 sq ft | $302 | 1989 |
| 9721 Cascade Falls Ave | May 2026 | $580,000 | 2,232 sq ft | $260 | 1989 |
| 3001 Bridge Creek St | May 2026 | $685,000 | 2,020 sq ft | $339 | 1989 |
| 9725 Cascade Falls Ave | February 2026 | $610,000 | 2,730 sq ft | $223 | 1989 |
| 9724 Cascade Falls Ave | December 2025 | $662,500 | 2,744 sq ft | $241 | 1989 |
| 9813 Bearpaw Ave | November 2025 | $690,000 | 2,744 sq ft | $251 | 1988 |
| 9917 Biscayne Ln | November 2025 | $476,500 | 1,800 sq ft | $265 | 1988 |
| 9921 Heffner Hills Cir | July 2025 | $625,000 | 2,185 sq ft | $286 | 1988 |
Recorded sales drawn from the Clark County parcel record, each price as the recorded document carries it. These are the sales the county itself holds around this address, not an estimate of this home's value. The county's own card for this address carries 2,730 sq ft, built 1988, last recorded sale $260,000 in June 1999.
Across 10 recorded sales the price per interior square foot runs $81 to $339.
Unemployment rate (Nevada) stands at 5% as of July 1, 2026 (-0.2 over twelve months and -0.3 over six). Homes actively listed (Las Vegas metro) stands at 10,788 as of August 1, 2026 (+693 over twelve months and +1,632 over six). New building permits (Las Vegas metro) stands at 740 a month as of July 1, 2026 (-107 over twelve months and -316 over six). Months' supply of new homes (US) stands at 9.6 months as of July 1, 2026 (+0.4 over twelve months and -0.3 over six).
10,788 homes are actively listed across the metro - a higher count than in 95.0% of the months in the past 5 years of that series. Buyers are choosing from a fuller shelf than usual. New building permits are running at 917 a month on a twelve-month average, lower than in 95.0% of the months in the same window.
Read together, the readings show mortgage rates holding at a high level, employment steady, listed supply elevated with oversupply risk, and new-home permits running low. Where two readings sit close together, both are carried with their weight: mortgage rates read stable high at 60 percent against rising gradually at 40 percent, and employment reads stable at 60 percent against growing at 40 percent.
The measured record runs from 1990-01 to 2026-07, 439 months in all. The exact combination of readings on today's card appears in 1 of them, and the current run has lasted 1 month.
Taken one reading at a time: mortgage rates at stable high in 16.6% of months, inflation at accelerating in 17.5% of months, employment at stable in 42.1% of months, listed supply at loose in 5.5% of months and new-home permits at constrained in 23.5% of months.
The closest month in the record is 2000-11,. It matches on mortgage rates both stable high, inflation both accelerating, employment both stable and new-home permits both constrained. It differs on the 30-year mortgage rate 6.58 now vs 7.73 then.
In the twelve months after that month, the 30-year mortgage rate went from 7.68 to 6.64, inflation went from 3.44 to 1.89, unemployment went from 3.9 to 5.5 and new building permits went from 2,420 to 2,206. That is the measured record of what followed then.
At the published asking price of $799,000, $293 per interior square foot across 2,730 square feet, the loan payment at 6.71% over thirty years with 20% down is $4,129 a month before tax and insurance.
Set against the common rule that housing costs stay under 28% of gross income, the entry looks like this: 10% down is $79,900 at closing, $5,629 a month, and implies about $241,236 of household income, 20% down is $159,800 at closing, $4,753 a month, and implies about $203,708 of household income and 30% down is $239,700 at closing, $4,237 a month, and implies about $181,589 of household income. Held five years at that rate, $208,319 goes to interest and $39,415 to principal, leaving $599,786 owed and $199,214 paid into the loan.
The Las Vegas-Henderson-Paradise metro holds 1,176,800 payroll jobs, adding 9,900 over the past twelve months. Leisure and hospitality leads at 25.5 percent of all employment, the defining driver of the local economy. Trade, transportation and utilities follow at 18.1 percent, and professional and business services at 15.6 percent. Government and private education and health services each carry roughly one in ten jobs, giving the metro a mix of tourism-facing and public-service employment.
The workforce here is anchored by hospitality and trade, with paycheques coming from resorts, warehouses, and public institutions. Leisure and hospitality jobs often pay below the metro norm, while professional services and healthcare roles pay above it. A stable payroll base across these sectors supports household incomes that fund both rental payments and mortgage obligations. Present payroll readings of 1,176,800 jobs and a 5.4% unemployment rate indicate a metro where employment is broad enough to sustain demand for homes across price points.
Census Tract 58.06, Clark County · American Community Survey five-year estimates, 2019-2023. Each line reads the immediate census area around this address against the county that holds it.
| Measure | This tract | Across the county |
|---|---|---|
| Median household income median annual income across all households, owners and renters together | $81,927 | $73,845 across Clark County |
| Households earning $100,000 or more share of all households with annual income at or above $100,000 | 45.1% | 35.6% across Clark County |
| Households earning under $35,000 share of all households with annual income below $35,000 | 20.5% | 22.3% across Clark County |
| Median home value median value of owner-occupied homes as reported by their owners | $482,100 | $400,800 across Clark County |
Named employers whose payrolls stand behind the measured series above.
Every figure below is a modelled scenario built from the stated assumptions. The model solves for what this property would have to collect to carry itself.
The method is fixed and runs in this order. Take the asking price, the live average 30-year rate and the down payment, and compute the loan payment. Add the property tax and insurance carried in the model.
On these assumptions the house has to collect $6,085 a month simply to stand still.
Each line is computed from the inputs named beside it: what the arithmetic does at those inputs, stated as a scenario.
| Scenario | Modelled | On what basis |
|---|---|---|
| Rent to break even on cash | $6,085 /mo | after 7% vacancy, 8% management, 8% maintenance |
| Rent for 1.2x loan cover | $7,142 /mo | the cushion a lender commonly asks for |
| Yield on price at break-even | 6.2% | net operating income divided by asking price |
| Occupancy needed | 93.0% | below this the modelled scenario runs at a loss |
| Loan cover at that rent | 1.0x | net operating income over annual debt service |
| Downside case | -$797 /mo | same rent cut 10% with vacancy doubled |
62.4% of renting households in the surrounding census area put 30% or more of their income toward rent.
Monthly rents measured across homes actually rented in the surrounding census area; not a prediction for this home. American Community Survey five-year estimates, 2019-2023.
Rent point measured across the surrounding census area, not this home; taxes assumed at 0.75% of price; insurance assumed $1,500/yr; vacancy assumed 8%; loan 30-year fixed at the current weekly average rate.
Rent point measured across the surrounding census area, not this home; taxes assumed at 0.75% of price; insurance assumed $1,500/yr; vacancy assumed 8%; loan 30-year fixed at the current weekly average rate.
Rent point measured across the surrounding census area, not this home; taxes assumed at 0.75% of price; insurance assumed $1,500/yr; vacancy assumed 8%; loan 30-year fixed at the current weekly average rate.
Census Tract 58.06, Clark County · American Community Survey five-year estimates, 2019-2023. Each line reads the immediate census area around this address against the county that holds it.
| Measure | This tract | Across the county |
|---|---|---|
| Median gross rent median monthly rent including utilities across all rented homes | $1,711 | $1,518 across Clark County |
| Renters paying 30%+ of income on rent share of renting households whose gross rent takes 30 percent or more of household income; households where the share could not be computed are excluded | 62.4% | 56.1% across Clark County |
| Owner-occupied homes share of occupied homes lived in by their owners | 57.3% | 57.0% across Clark County |
| Average household size average number of people per occupied home | 2.47 people | 2.68 people across Clark County |
Then solve the question backwards: what monthly rent would this house have to collect for the income left after vacancy, management and maintenance to cover that carrying cost. That figure is arithmetic on the assumptions below - it says what the property needs to collect.
The carrying cost, item by item. A 20% down payment on $799,000 leaves $639,200 borrowed; at 6.71% over thirty years that is $4,129 a month, $49,548 a year. Property tax is carried at $5,992 a year and insurance at $1,500 a year. Cash needed at closing works out at $179,775 - the down payment plus closing costs assumed at 2.5% of price.
Solving backwards. Assume 7% of the year empty, management at 8% and maintenance at 8% of what is collected - the standing assumptions of the rental model, stated so they can be argued with. On those terms the property breaks even on cash at $6,085 a month.
To cover the loan payment 1.2 times over - the cushion a lender usually looks for - it needs $7,142. At break-even rent the yield on price is 6.2% and the scenario tips into loss whenever occupancy falls below 93.0%.
The downside case is worth stating in the same breath. Take $6,085 a month, cut the rent 10% and double the vacancy assumption, and the same house runs $797 a month short - $9,564 over the year. That is the shape of the risk: the whole answer moves with the rent the property collects.
The nearest named place in each category, with the time it actually takes along real streets.
| Category | Nearest named place | Walk | Drive |
|---|---|---|---|
| Bars and nightlife | Chicago brewing company | 28 min | 6 min |
| Culture and attractions | Sahara West Library and Fine Arts Museum | 10 min | 3 min |
| Dry cleaning | Tide Cleaners | 14 min | 2 min |
| Entertainment | Sahara West Library Art Gallery | 10 min | 2 min |
| Fire station | City of Las Vegas Fire Station Number 2 | 59 min | 7 min |
| Fuel station | Arco | 14 min | 3 min |
| Gyms and sport | Canyon Gate Country Club | 42 min | 5 min |
| Health care | Care Now Urgent Care | 15 min | 4 min |
| Hotels | La Quinta Inn & Suites | 13 min | 5 min |
| Library | Sahara West Library | 11 min | 4 min |
| Places of worship | young Israel Aish HaTorah | 12 min | 4 min |
| Restaurants and cafes | Nacho Daddy | 11 min | 5 min |
| Transit | Westcliff Transit Center | 73 min | 7 min |
Sahara West Library Art Gallery is the closest named place on foot, 10 min away along real streets.
Recorded places reached inside each band, measured along the real street network from this address - every mode, every band that was measured.
| Mode | 5 min | 10 min | 15 min | 20 min |
|---|---|---|---|---|
| On foot | 0 | 1 | 12 | 33 |
| By bicycle | 3 | 77 | 163 | |
| Driving | 105 | 824 | 2,263 |
Edge minutes are walked from the area's own boundary; the other minutes from its center.
| Category | Walk from the edge | Walk | Cycle | Drive |
|---|---|---|---|---|
| Parks & recreation | 0 min | 21 min | 7 min | 3 min |
| Shops Tide Cleaners | 1 min | 14 min | 5 min | 2 min |
| Fuel station Arco | 1 min | 14 min | 5 min | 3 min |
| Library Sahara West Library Art Gallery | 1 min | 10 min | 4 min | 2 min |
| Library Sahara West Library and Fine Arts Museum | 2 min | 10 min | 4 min | 3 min |
| Healthcare Care Now Urgent Care | 2 min | 15 min | 7 min | 4 min |
| Library Sahara West Library | 3 min | 11 min | 5 min | 4 min |
| Places of worship young Israel Aish HaTorah | 3 min | 12 min | 6 min | 4 min |
| Restaurants & cafes Nacho Daddy | 4 min | 11 min | 6 min | 5 min |
| Lodging La Quinta Inn & Suites | 4 min | 13 min | 7 min | 5 min |
| Recreation features | 10 min | 22 min | 8 min | 3 min |
Every category, placed against the 40 areas measured across the city. The standing counts network travel time to recorded places, nothing else; the right-hand column is the share of measured areas whose reading sits below this one's.
| Category | Standing | Areas behind it |
|---|---|---|
| Lodging | 2nd of 40 | 97% |
| Attractions & culture | 5th of 40 | 90% |
| Entertainment | 7th of 40 | 85% |
| Restaurants & cafes | 7th of 40 | 85% |
| Healthcare | 10th of 40 | 77% |
| Places of worship | 13th of 40 | 69% |
| Everyday services | 17th of 40 | 59% |
| Bars & nightlife | 17th of 40 | 59% |
| Schools & education | 18th of 40 | 56% |
| Shops | 19th of 40 | 54% |
| Transit | 20th of 40 | 51% |
| Recreation features | 37th of 40 | 8% |
| Parks & recreation | 38th of 40 | 5% |
| Sports & fitness | 38th of 40 | 5% |
| Civic services | 39th of 40 | 3% |
The same measured categories, weighted the way different households lean on them - errands close at hand for one, evening reach for another - with every area in the city read identically.
| Household profile | Standing | Areas behind it |
|---|---|---|
| Investor | 6th of 40 | 87% |
| Family | 25th of 40 | 38% |
| Nightlife oriented | 8th of 40 | 82% |
| Retiree | 19th of 40 | 54% |
| Commuter | 16th of 40 | 62% |
| Outdoors oriented | 39th of 40 | 3% |
Every named business and place the map records inside the area itself - 27 of them, grouped by what they are.
Each pin is a named place, measured from this address along the street network.
The address is on a residential street with 2.06 street legs per crossing on average, and 1.3% of the named streets in the area are arterial roads. This is the measured shape of the road network: street type, through routes, and the roads that carry traffic past the area rather than through it.
Cotton Cloud Road is a residential street; the traffic sits on South Hualapai Way and West Desert Inn Road.
Against a city middle of 55.4 across 40 measured areas - a tighter grid than most, which usually means more ways in and more traffic through.
Every street Cotton Cloud Road meets, each with its own measured class and length. 0 of them carry through traffic. Cotton Cloud Road itself runs under a quarter mile end to end.
| Cross street | Class | Length |
|---|---|---|
| Falling Star Avenue | residential | 0.1 mi |
| Morning Dew Street | residential | 0.1 mi |
| Setting Sun Street | residential | 0.2 mi |
How the people living around this address actually travel to work, measured across the immediate census area and read against the county.
| Measure | This tract | Across the county |
|---|---|---|
| Average commute average one-way travel time to work among residents who commute | 25.6 minutes | 25.2 minutes across Clark County |
| Commutes of 30 minutes or more share of commuting residents travelling 30 minutes or longer each way | 39.7% | 35.7% across Clark County |
| Commutes under 15 minutes share of commuting residents travelling under 15 minutes each way | 17.4% | 19.2% across Clark County |
| Drive alone to work share of workers who drive alone | 72.1% | 72.6% across Clark County |
| Work from home share of workers whose workplace is their home | 15.0% | 10.7% across Clark County |
Fire station 5 minutes, medical care 1 minute and police station 10 minutes away.
Named health infrastructure the map records inside the area itself - each one a real, named place, not a category count.
How traffic physically reaches this address, measured from the street network - the street's own class, the crossings it has, and the roads built to carry the load instead.
Free-flow network estimate from zone center; not a response-time measurement.
The zoning designation in plain words, the rules standing on the lot, and each hazard as a reading with its source.
Outside mapped flood hazard areas
This property sits outside both the 1-percent and 0.2-percent annual-chance flood areas that FEMA maps nationally, so a standard mortgage here carries no flood-insurance requirement. The nearest mapped flood hazard area, in the neighboring X section, is about half a mile away.
Source: FEMA National Flood Hazard Layer, read at this property's coordinates.
| On a federal register | Distance | The record |
|---|---|---|
| Petco Store #2128 | 0.4 mi | 10000 W Sahara Ste #120. Holds a federal hazardous-waste handler registration |
| Sahara Center Llc | 0.4 mi | 10000 W Sahara Ave |
| Albertsons #6013 | 0.7 mi | 2550 S Fort Apache Rd. Holds a federal hazardous-waste handler registration |
| Al Phillips The Cleaner | 0.8 mi | 9232 W Sahara Ave 1A. Holds a federal hazardous-waste handler registration |
| Energy Inspectors Building | 0.8 mi | W Sahara Avenue |
| Ravenwood | 0.9 mi | Hualapai Way |
Named facilities on federal environmental registers within a mile of the address, each with its measured straight-line distance. A listing reflects a permit or registration on public record, not a violation. Source: EPA enforcement and compliance records.
A homebuyer shopping for coverage in Nevada typically encounters a standard policy covering fire, liability, and theft, with earthquake and flood requiring separate arrangements. This property falls outside mapped flood hazard areas, eliminating the lender-imposed flood requirement. Its wildfire rating of "not rated" places it outside rated risk areas. The seismic classification of Category D, Nevada's lowest hazard tier, indicates minimal earthquake exposure. The regional climate, with an average of 64 days annually reaching 100 F, factors into underwriting conversation but does not reshape the standard coverage framework available in the state.
Written from the hazard readings on this page; an insurer prices the actual policy.
The nearest schools by measured travel are M.J. Christensen Elementary School, Sig Rogich Middle School and Faith Lutheran Junior and Senior High School.
M.J. Christensen Elementary School, Sig Rogich Middle School and Faith Lutheran Junior and Senior High School - thirteen years, three schools, measured from the door.
The closest named school at each level, measured from this address along the street network.
Dates are arithmetic on today's calendar: which schools sit on the path, and when the years fall.
| School | Level | Grades | Distance |
|---|---|---|---|
| M.J. Christensen Elementary School | Elementary | PK-5 | 0.8 mi |
| Clarence Piggott Elementary School | Elementary | PK-5 | 0.9 mi |
| Faith Lutheran Junior and Senior High School | High school | 9-12 | 1.0 mi |
| Herbert A Derfelt Elementary School | Elementary | PK-5 | 1.9 mi |
| Walter Jacobson Elementary School | Elementary | PK-5 | 2.5 mi |
| Palo Verde High School | High school | 9-12 | 2.6 mi |
| Givens Elementary School | Elementary | PK-5 | 2.7 mi |
| Sig Rogich Middle School | Middle | 6-8 | 2.8 mi |
| Walter Johnson Middle School | Middle | 6-8 | 3.2 mi |
| Bonanza High School | High school | 9-12 | 4.1 mi |
| Becker Middle School | Middle | 6-8 | 4.2 mi |
| Community College West Charleston High School | High school | 9-12 | 4.4 mi |
| School | Measured from here |
|---|---|
| Calvary Christian Learning Academy | 16 min by car |
| Our Lady of Las Vegas Catholic School | 16 min by car |
| Mountain View Lutheran School | 14 min by car |
Real, named institutions, each with what it is known for, how it admits, and where its graduates go.
The fields taught in this metro, the institution that teaches each, and named local employers who hire it.
Ordered by how much of the metro's measured payroll each sector carries.
Common routes from named local high schools into named local payrolls - the coursework, the institution in between, and the employers at the end.
| Series | Latest | 6-month change | 12-month change | As of |
|---|---|---|---|---|
| 30-year mortgage rate (US average) | 6.71% | +0.33 | +0.41 | September 2026 |
| Inflation, CPI year-over-year (US) | 3.3% | +0.91 | +0.56 | July 2026 |
| Unemployment rate (US) | 4.1% | -0.3 | -0.2 | August 2026 |
| Unemployment rate (Nevada) | 5% | -0.3 | -0.2 | July 2026 |
| Homes actively listed (Las Vegas metro) | 10,788 | +1,632 | +693 | August 2026 |
| New building permits (Las Vegas metro) | 740/mo | -316 | -107 | July 2026 |
| Months' supply of new homes (US) | 9.6 mo | -0.3 | +0.4 | July 2026 |
The market this purchase happens in, as the official series report it. Every line carries its own reading date.
The record runs from January 1990 to July 2026.
Measured against 439 months of history from January 1990 onward. The right-hand column is how often each reading has held in that record.
| Dimension | Reading now | Share of history |
|---|---|---|
| Interest rates | stable high | 16.6% |
| Employment | stable | 42.1% |
| Homes for sale | elevated oversupply risk | 5.5% |
| New construction | constrained | 23.5% |
Months in the measured record whose conditions most closely match today's. Similarity is a measurement of what happened, not a forecast.
| Month | Similarity | Why it matches |
|---|---|---|
| November 2000 | 0.94 | Interest rates: both stable high; Inflation: both accelerating; Employment: both stable |
| December 2004 | 0.84 | Interest rates: both stable high; Inflation: both accelerating; Employment: both stable |
| November 1996 | 0.83 | Interest rates: both stable high; Inflation: both accelerating; Employment: both stable |
| September 2005 | 0.82 | Interest rates: both stable high; Inflation: both accelerating; Employment: both stable |
| October 2007 | 0.82 | Interest rates: both stable high; Inflation: both accelerating; New construction: both constrained |
| March 2007 | 0.77 | Interest rates: both stable high; Employment: both stable; New construction: both constrained |
The 8 most similar months on record (April 1995 to October 2007), and the full measured range of what followed each of them - the low, the middle and the high of every series, with the month each extreme followed. The matching is range of what actually followed the 8 most similar months on record, matched on rates, inflation, employment and construction conditions. A range is a record of what happened then, not a forecast of what happens next.
| Series | Horizon | Lowest that followed | Median | Highest that followed |
|---|---|---|---|---|
| 30-year mortgage rate | 6 months on | -0.76 after April 1995 | +0.1 | +0.72 after April 1999 |
| Inflation (CPI, year over year) | 6 months on | -1.32 after September 2005 | -0.18 | +0.29 after October 2007 |
| Unemployment rate (US) | 6 months on | -0.5 after November 1996 | -0.25 | +0.4 after November 2000 |
| Building permits (Las Vegas metro) | 6 months on | -3,945 after October 2007 | +439 | +2,612 after December 2004 |
| 30-year mortgage rate | 12 months on | -1.04 after November 2000 | -0.14 | +1.25 after April 1999 |
| Inflation (CPI, year over year) | 12 months on | -2.73 after September 2005 | -0.15 | +1.17 after March 2007 |
| Unemployment rate (US) | 12 months on | -0.8 after November 1996 | -0.35 | +1.8 after October 2007 |
| Building permits (Las Vegas metro) | 12 months on | -3,869 after October 2007 | -331 | +934 after December 2004 |
| 30-year mortgage rate | 24 months on | -1.55 after November 2000 | -0.68 | +0.74 after September 2005 |
| Inflation (CPI, year over year) | 24 months on | -3.83 after October 2007 | -1.48 | +0.94 after April 1999 |
| Unemployment rate (US) | 24 months on | -1 after December 2004 | -0.1 | +5.3 after October 2007 |
| Building permits (Las Vegas metro) | 24 months on | -4,326 after October 2007 | +64 | +1,520 after April 1999 |
The metro's payroll record, series by series - each with its latest reading, its measured twelve-month and five-year changes, and its share of the whole.
| Series | Latest | 12-month | 5-year | What it counts |
|---|---|---|---|---|
| Total payroll employment | 1,176,800 jobs (July 2026) | +9,900 | +167,400 | Every payroll job in the metro, counted monthly; over the past decade the count has run from 775,200 to 1,176,800. |
| Unemployment rate | 5.4% (July 2026) | -0.3 pts | -3.2 pts | Share of the metro workforce between jobs and looking; the ten-year span runs 4% to 34%. |
| Leisure and hospitality | 300,400 jobs (July 2026) | -1,900 | +44,600 | 25.5% of all metro payrolls (300,400 of 1,176,800 jobs). |
| Trade, transportation and utilities | 212,800 jobs (July 2026) | +800 | +17,300 | 18.1% of all metro payrolls (212,800 of 1,176,800 jobs). |
| Professional and business services | 183,300 jobs (July 2026) | +9,700 | +37,300 | 15.6% of all metro payrolls (183,300 of 1,176,800 jobs). |
| Private education and health services | 142,700 jobs (July 2026) | +7,200 | +31,900 | 12.1% of all metro payrolls (142,700 of 1,176,800 jobs). |
| Government | 121,500 jobs (July 2026) | +1,000 | +14,400 | 10.3% of all metro payrolls (121,500 of 1,176,800 jobs). |
| Construction | 81,900 jobs (July 2026) | +1,300 | +11,200 | 7.0% of all metro payrolls (81,900 of 1,176,800 jobs). |
| Financial activities | 61,100 jobs (July 2026) | -900 | +5,900 | 5.2% of all metro payrolls (61,100 of 1,176,800 jobs). |
| Manufacturing | 31,100 jobs (July 2026) | +300 | +5,400 | 2.6% of all metro payrolls (31,100 of 1,176,800 jobs). |
The sectors that carry the metro's paycheques, largest first - who does the work, where the hiring runs, and how the pay tends to sit.
Census Tract 58.06, Clark County · American Community Survey five-year estimates, 2019-2023. Each line reads the immediate census area around this address against the county that holds it.